PRIVATE PREVIEW · LOCAL-FIRST

Your broker's chart. Not someone else's.

Two brokers hand you different H4 candles for the same market, and most tools quietly show you one of them. TradeSetupPRO rebuilds every timeframe from the history you export, on the clock your broker runs — then backtests on it, without uploading a thing.

Charting, importing and every drawing tool are free and stay free.

  • Data stays on your device
  • Unlimited history
  • Honest backtest results
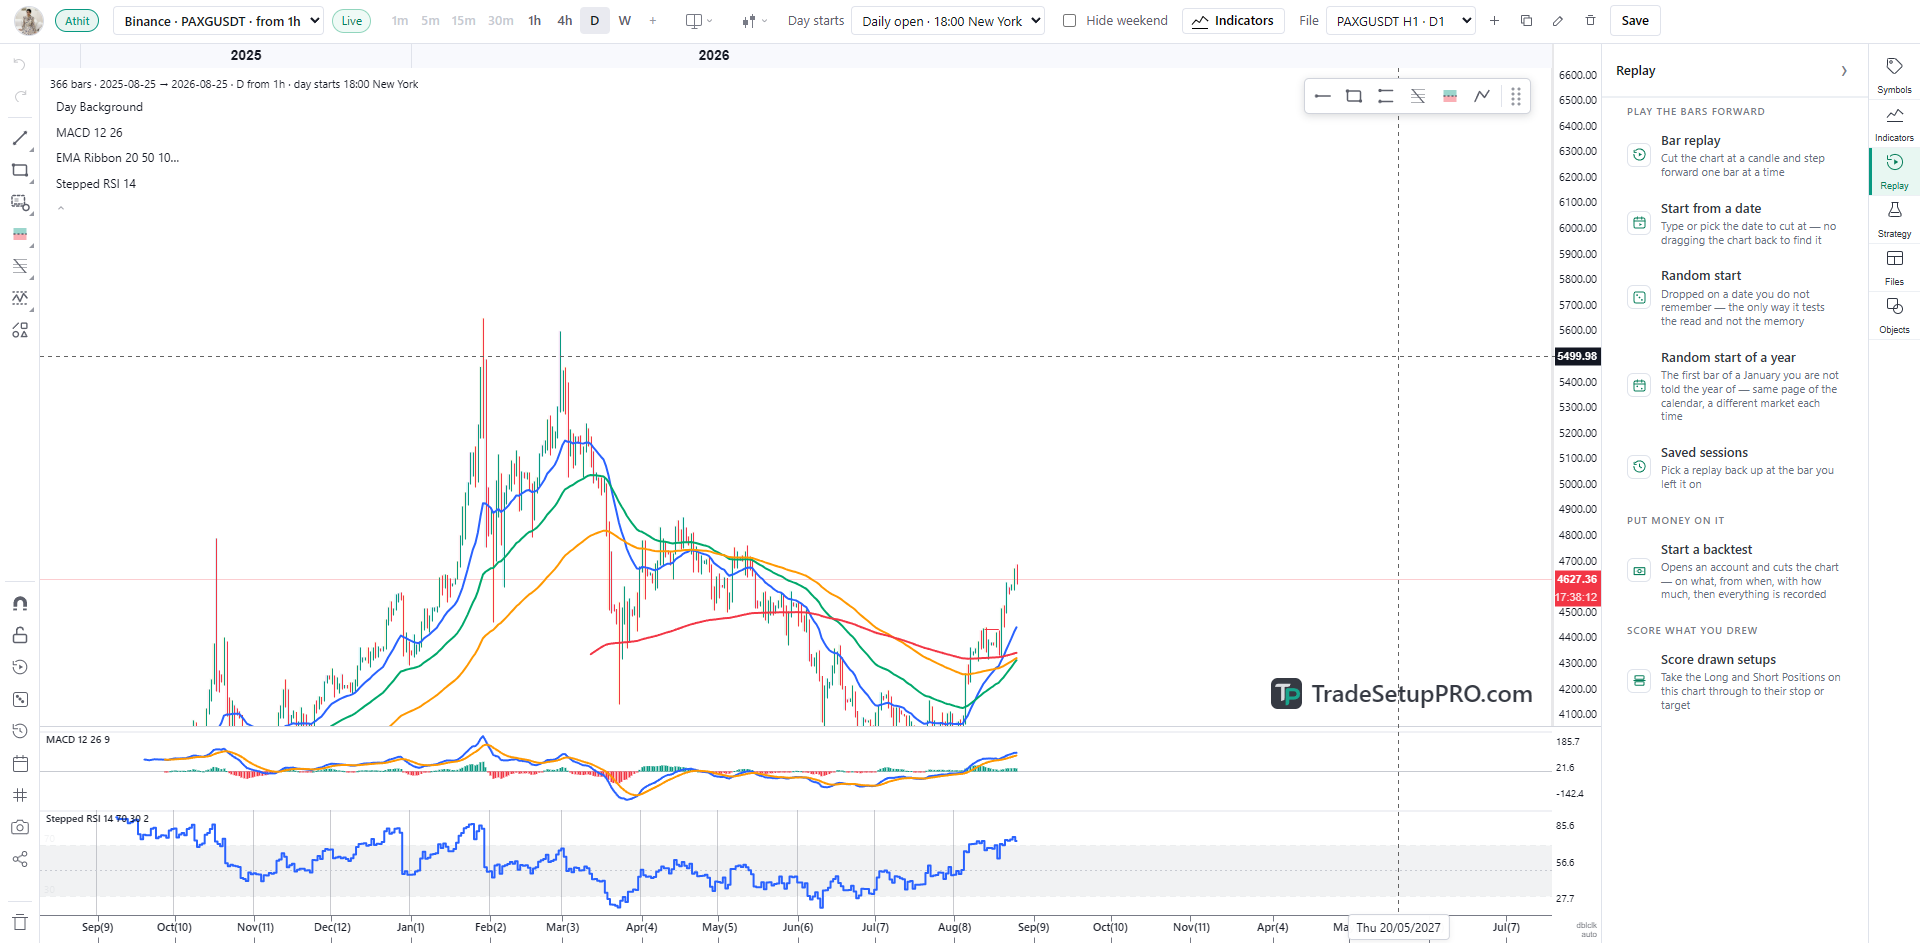
The TradeSetupPRO workspace showing a daily candle chart with an EMA ribbon, MACD and a stepped RSI.
A screenshot of the running app, not a mockup
Reads exports from

See the real thing

This is what you actually work in

Chart and indicators

Bars cut the way your broker cuts them

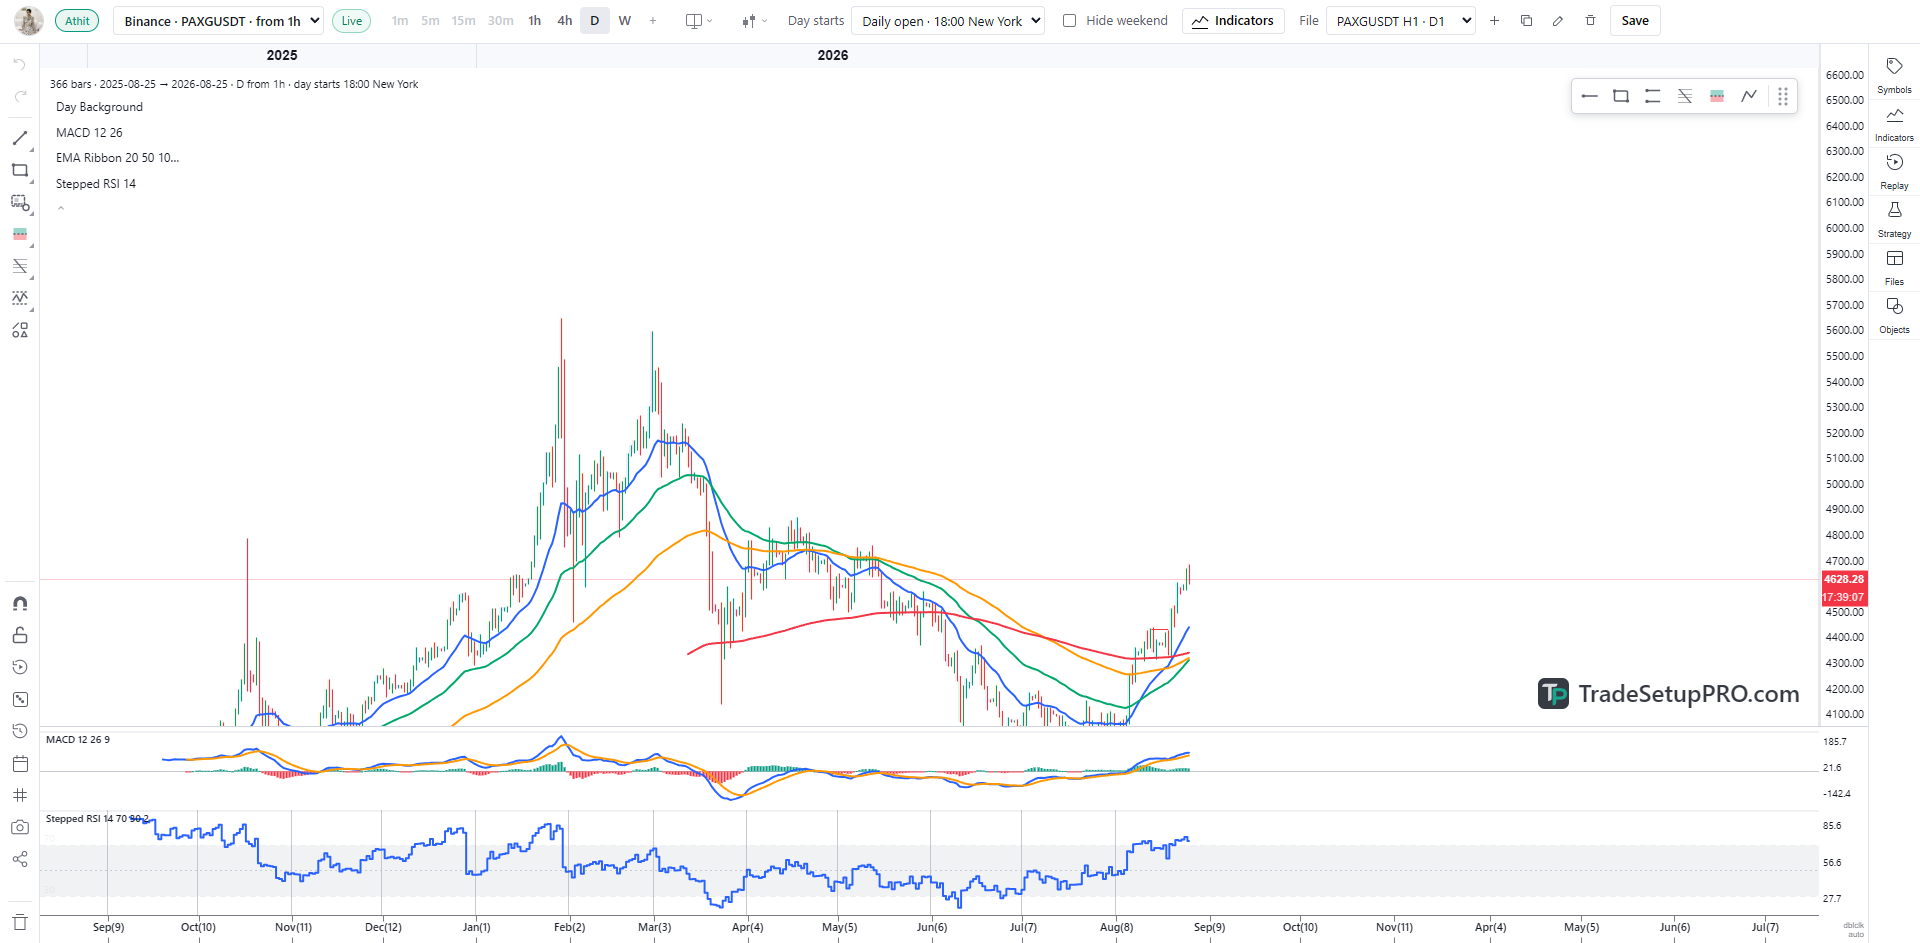
MT5 anchors bars to midnight on the server clock, so a GMT+2 broker and a GMT+3 broker disagree about every 4-hour candle. Higher timeframes here are rebuilt from your own export, on the clock you choose, so H4 and D1 match the terminal you actually trade.

The TradeSetupPRO workspace showing a daily candle chart with an EMA ribbon, MACD and a stepped RSI.
Import your own data

Works with whoever you trade with

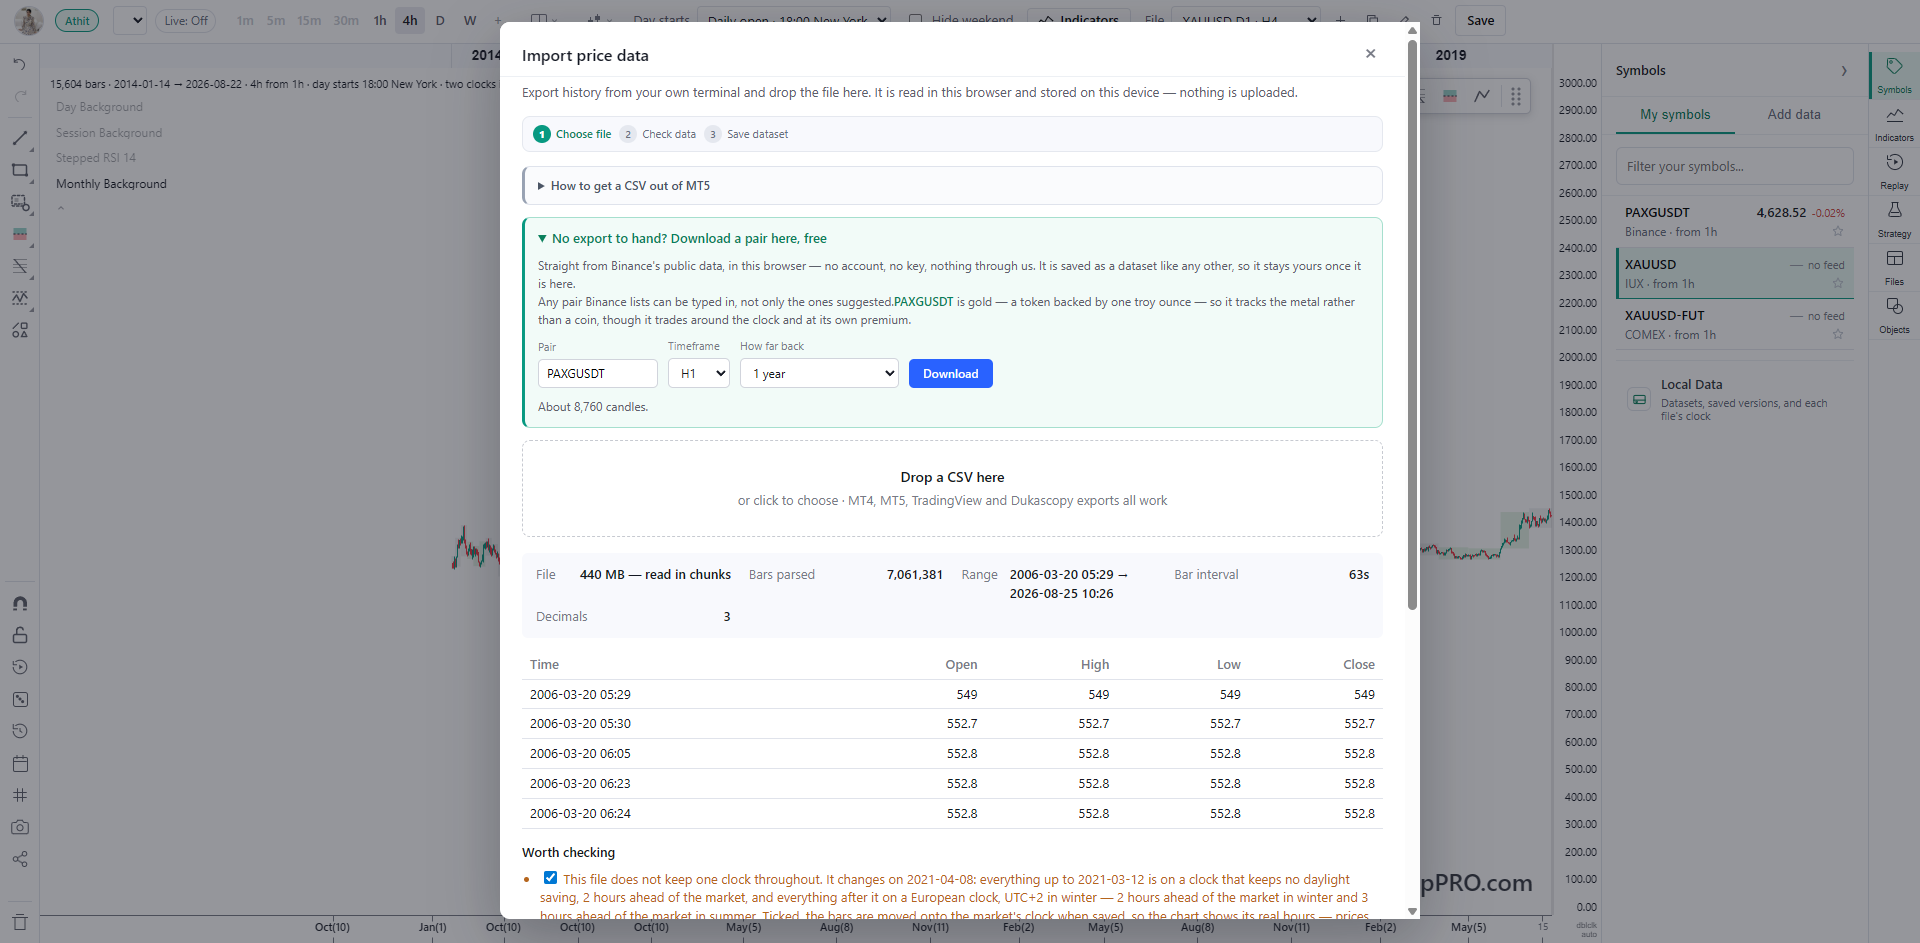
Export from MT4, MT5, TradingView or Dukascopy and drop the file in. The format is worked out from the file itself — delimiter, header, columns, date layout — and the gaps, duplicates and bad bars it finds are shown before anything is saved.

The import panel reporting bars parsed, the date range it covers and a warning about the clock changing inside the file.
Replay and backtest

A backtest that admits what it cannot know

When one bar touches both your stop and your target, OHLC cannot say which came first. Every such bar is counted as a loss and the total is reported, because the assumption decides the result.

The replay panel offering bar-by-bar playback, a random start date and a backtest run.

And the rest of what is in there

Your data never leaves the machine

Price history and anything you write are read and stored in your browser. There is no upload, no account needed to chart, and no server that ever sees a position of yours. Open DevTools and watch the network tab — that is the whole proof.

Write your own indicators and strategies

A small JavaScript API with the technical-analysis primitives already provided. Your code runs in a sandboxed worker with no network and no page access, gets the same settings panel the built-ins get, and is stored on your device.

Seventeen drawing tools

Rays, boxes, channels, Fibonacci with editable levels, range projections, and long/short position tools that size a trade from lot, leverage, spread, commission and swap — in your account currency.

The number most backtests won't show you

When a single bar's range covers both your stop and your target, the candle cannot tell you which was touched first. Assume the target and results look wonderful. Assume the stop and they look ordinary. Same trades, same data:

Counted as losses36.5%win rate — the default here
Counted as wins80.9%win rate — the flattering read

Measured on the app's own demo data. TradeSetupPRO takes the pessimistic side by default and tells you how many trades it applied to, so you know how much of a result rests on an assumption rather than on your rules.

Pricing

One payment. No subscription, no expiry. Two devices, and a slot moves when you do. Updates for a year; the version you have keeps working after that.

Free

$0

No signup. Enough to prove it works on your own data.

  • Your own broker data, imported and charted
  • The eight standard timeframes on your broker's clock, and 1 interval of your own — 3-minute, 45-minute, 2-hour
  • Import at 1 minute or 1 hour — about a year of the minutes, or all the hours you have
  • All 17 drawing tools, and the classical indicators without limit
  • One saved chart of your own, up to 100 drawings
  • Replay trading in full — account, statistics, journal
  • 3 backtest runs, and 3 scripts of your own
  • Export everything you make, always
Open the app

Questions

Is this a subscription?

No. You pay once. Updates are included for a year; after that the version you have keeps working exactly as it did, offline, with no expiry. Renew only if you want the newer builds.

Where does the price data come from?

From you. Export history from the broker you trade with and import it — that way the chart matches your terminal instead of some third party's feed. No market data is bundled, and none is ours to redistribute.

Does it work offline?

Yes. After the first load everything runs locally, including licence checks — the licence is a signed key your browser verifies on its own, not a call to a server.

Does it place trades?

No. It is an analysis and testing tool. It does not connect to a broker, cannot send an order, and never asks for account credentials.

Which markets does it work with?

Any instrument you can export bars for — gold, forex, indices, crypto. Nothing in it is specific to one symbol.

What if my data is a strange format?

Try it — the importer works the format out from the file and shows you what it found before saving anything. Charting is free, so it costs nothing to check.

Keep reading

Setups and the knowledge library

Trade plans written out properly, and the foundations behind them — all free to read.

All setups →

Browse the library →

GOLD / XAUUSD

Gold trading guides

Foundations, opportunities and risk management for XAUUSD.

Check it against your own export

Charting is free. If the H4 doesn't match your terminal, you've lost nothing.

Open the app

Already have a preview code?

Early access is limited to people who received a code. Enter it once — this device remembers.